
ATG13 phospho S318 Antibody, Unconjugated, Rabbit, Polyclonal Preis auf Anfrage
Catalog Number:
BYT-ORB345689
- Images (6)


| Article Name: | ATG13 phospho S318 Antibody, Unconjugated, Rabbit, Polyclonal Preis auf Anfrage |
| Biozol Catalog Number: | BYT-ORB345689 |
| Supplier Catalog Number: | orb345689 |
| Alternative Catalog Number: | BYT-ORB345689-25 |
| Manufacturer: | Biorbyt |
| Host: | Rabbit |
| Category: | Antikörper |
| Application: | DOT, ELISA, WB |
| Species Reactivity: | Human |
| Immunogen: | This affinity purified antibody was prepared by repeated immunizations with a synthetic peptide corresponding to the region near S318 of ATG13. |
| Conjugation: | Unconjugated |
| Alternative Names: | rabbit anti-ATG13 pS318 Antibody, ATG-13, ATG 13, Autophagy-related protein 13, KIAA0652 |
| ATG13 (phospho-S318) antibody |
| Clonality: | Polyclonal |
| Concentration: | 1.1 mg/mL |
| NCBI: | 001136145 |
| UniProt: | O75143 |
| Buffer: | Preservative: 0.01% (w/v) Sodium Azide. Stabilizer: None, Buffer: 0.02 M Potassium Phosphate, 0.15 M Sodium Chloride, pH 7.2 |
| Purity: | This affinity-purified antibody is directed against the phosphorylated form of human ATG13 protein at the pS318 residue. The product was affinity purified from monospecific antiserum by immunoaffinity purification. Antiserum was first purified against the phosphorylated form of the immunizing peptide. The resultant affinity purified antibody was then cross adsorbed against the non-phosphorylated form of the immunizing peptide. Reactivity occurs against human ATG13 pS318 protein and the antibody is specific for the phosphorylated form of the protein. Reactivity with non-phosphorylated human ATG13 is minimal by ELISA and western blot. A BLAST analysis was used to suggest cross reactivity with ATG13 from human based on 100% sequence homology with the immunogen. Reactivity against homologues from other sources is not known. |
| Form: | Liquid (sterile filtered) |
| Application Dilute: | ELISA: 1:25,000-1:175,000, WB: 1:1000 |
| Application Notes: | Application Notes: This affinity purified antibody has been tested for use in ELISA and by western blot. Specific conditions for reactivity should be optimized by the end user. Expect a band approximately 56.6 kDa in size corresponding to human phosphorylated ATG13 protein by western blotting in the appropriate stimulated tissue or cell lysate or extract |
|
|
Autophagic vesicles are locally formed in dendrites of cultured neurons following LTD. A) Top, representative super-resolution microscopy dSTORM image of a secondary dendrite labeled with an antibody against LC3, 15 min after cLTD. Bottom, magnification of representative U-shaped LC3-positive structures in dendrites, 15 min after NMDA or DHPG pulses. Scale bars: 2 µm and 250 nm, as indicated. (N = 3 independent experiments). B) Graph showing the number of LC3-positive U-shaped structures in secondary dendrites visualized in (a), before (control) and 15 min or 60 min after NMDAR- and mGluR-LTD. Bars represent mean values SEM. N = 3 independent experiments per condition (n > 9 dendrites per condition). Statistical analysis was performed by one-way ANOVA. For the time point of 15 min F(2, 33) = 17.93, p 40 dendrites per condition). D) Confocal images of dendrites immunolabeled with antibodies against WIPI2, LC3, and MAP2 before (control) or after 15 min of NMDAR- and mGluR-LTD. Scale bar: 10 µm. (N = 6 independent experiments). E) Representative confocal images of neurons immunolabeled with antibodies against ULK1, Atg101, Atg13, FIP200 and, along with MAP2 to label dendrites before (control) or 15 min after LTD-inducing pulses. Scale bar: 20 µm. Graphs showing the number of puncta positive for each ULK1-complex component in secondary dendrites, normalized for dendrite length, in every condition, as indicated. Graph bars represent mean values SEM. N = 6 independent experiments per condition. Statistical analyses were performed using one-way ANOVA. ULK1: F(2, 15) = 24.48, P < 0.0001 (Tukeys multiple comparison test, Pcontrol_NMDAR < 0.0001, Pcontrol_mGluR < 0.0001, PNMDAR_mGluR = 0.8825). Atg101: F(2, 15) = 24.31, P < 0.0001 (Tukeys multiple comparison test, Pcontrol_NMDAR < 0.0001, Pcontrol_mGluR < 0.0001, PNMDAR_mGluR = 0.9329). Atg13: F(2, 15) = 8.386, P = 0.0036 (Tukeys multiple comparison test, Pcontrol_NMDAR = 0.007, Pcontrol_mGluR = 0.0086, PNMDAR_mGluR = 0.9940). FIP200: F(2, 15) = 17.66, P = 0.0001 (Tukeys multiple comparison test, Pcontrol_NMDAR = 0.0002, Pcontrol_mGluR = 0.0009, PNMDAR_mGluR = 0.6440). F) Western blot analyses for Atg13, FIP200, ULK1, Atg101, LC3, and beta-III tubulin (Tuj1) in neuronal lysates, under control conditions and 15 min after NMDAR- and mGluR-LTD. Graphs showing the normalized protein levels of Atg13, FIP200, ULK1, Atg101 under the aforementioned conditions. Bars represent mean values SEM. N = 3 independent experiments for ULK1 complex proteins, N = 5 independent experiments for LC3-II. Statistical analyses were performed using one-way ANOVA. ULK1: F(2, 6) = 13.57, P = 0.0059 (Tukeys multiple comparison test Pcontrol_NMDA = 0.0056, Pcontrol_DHPG = 0.0253). Atg101: F(2, 6) = 27.57, P = 0.0009 (Tukeys multiple comparison test Pcontrol_NMDA = 0.0013, Pcontrol_DHPG = 0.79). Atg13: F(2, 6) = 113.1, P < 0.0001 (Tukeys multiple comparison test Pcontrol_NMDA = 0.0027, Pcontrol_DHPG < 0.0001). FIP200: F(2, 6) = 15.14, P = 0.0045 (Tukeys multiple comparison test Pcontrol_NMDA = 0.0240, Pcontrol_DHPG = 0.041). LC3-II: F (2, 12) = 4, 969, P = 0.0268 (Tukeys multiple comparison test Pcontrol_NMDA = 0.0478, Pcontrol_DHPG = 0.0421). |
|
|
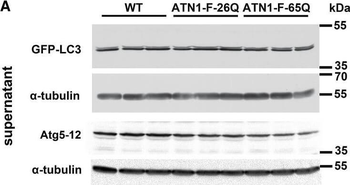
Inhibition of Autophagy Flux at Lysosomal Level and Decrease in Autophagy Initiation Signaling in DRPLA(A-C) The ratio of LC3II to LC3I was used to quantify autophagic flux in western blot analysis of full-length GFP-LC3 in the supernatant fraction of cerebellar lysates at 14 weeks of age (A). The anti-LC3 antibody recognizes a doublet between 35 and 55 kDa (Figure S4B), consistent with GFP-LC3-I (upper) and cleaved GFP-LC3-II (lower). The level of Atg5-12 conjugate was used to quantify the events of autophagy initiation. Densitometric analysis shows a decreased relative abundance of cleaved GFP-LC3-II to full-length GFP-LC3-I (B) in ATN1-FL-65Q,GFP-LC3 (65Q) mice compared to ATN1-FL-26Q,GFP-LC3 (26Q) and WT,GFP-LC3 (wt) mice. Atg5-12 conjugate (C) is also decreased in ATN1- |
|
|
|
|
|
|
|
|
|
|
|
Product Guarantee and Expert Support
