RFP Antibody, Unconjugated, Gallus, Polyclonal Preis auf Anfrage
Biozol Catalog Number:
BYT-ORB345910
Supplier Catalog Number:
orb345910
Alternative Catalog Number:
BYT-ORB345910-100
Manufacturer:
Biorbyt
Host:
Gallus
Category:
Antikörper
Application:
ELISA, WB
Species Reactivity:
Other
Immunogen:
The immunogen is a Red Fluorescent Protein (RFP) fusion protein corresponding to the full length amino acid sequence (234aa) derived from the mushroom polyp coral Discosoma.
Conjugation:
Unconjugated
Alternative Names:
chicken anti-RFP antibody, DsRed, rDsRed, Discosoma sp. Red Fluorescent Protein, Red fluorescent protein drFP583
Preservative: 0.01% (w/v) Sodium Azide. Stabilizer: None, Buffer: 0.02 M Potassium Phosphate, 0.15 M Sodium Chloride, pH 7.2
Purity:
RFP Antibody was prepared from egg yolks by a multi-step process which includes filtration, delipidation, salt fractionation and extensive dialysis against the buffer stated above. RFP Antibody was tested by Western blot.
Form:
Liquid (sterile filtered)
Application Dilute:
ELISA: 1:10,000, WB: 1:1,000 - 1:3,000
Application Notes:
Application Notes: Anti-RFP is designed to detect recombinant RFP. Anti-RFP antibody has been tested by ELISA, SDS-PAGE, and western blot to detect RFP. Use either alkaline phosphatase or peroxidase conjugated polyclonal anti-RFP to detect RFP or RFP containing proteins on western blots. Optimal titers for applications should be determined by the researcher. This product shows optimal performance by western blot
Differential expression of TRKC in PSNs prior to the cell death period. a Scheme of our working hypothesis. b, c Temporal fate mapping of TRKC PSNs by 4-OHT induction. TrkCCreER mice allow temporary activation of CreER in the TRKC + cells 2 h after 4-OHT injection21, 22. Immunostaining for PV, RFP and RUNX3 on E17.5 DRG sections (c) and graph showing distribution of PV + /RUNX3 + PSNs among the TOM + cells (n = 4). Scale bar: 20 µm. d Quantification of PSNs at C5 and C7. ***P < 0.001, one-way analysis of variance (ANOVA) with Sidaks multiple comparisons test (n = 2-3). The window of PSNs cell death is shown. e TRKC expression in E11.5 ISL1 + (and RUNX3 +, whose staining is not shown for more visibility) DRG neurons. Scale bar: 50 µm. f TRKC levels in PSNs of e illustrated by color coding, dark blue indicates the lower and red the higher TRKC levels. From here, all observations are done at brachial levels (C5-8). g Distribution of TRKC levels in PSNs from e. h Distribution of TRKC levels in PSNs in E11.5 DRG neurons (from g). The data exhibit a Poisson-like distribution (one representative animal), with the mean used to define the two different categories of TRKC intensity (TRKCHigh and TRKCLow). i Projection of seven images of RUNX3 + /TRKC + PSNs from one brachial DRG, dots indicate TRKC-labeled neurons and color codes reveal TRKC intensity as shown in h. j Projection image of smFISH for pan Ntrk3 and Ntrk3 full length (FL) transcripts in E11.5 DRG, visualized at high magnification in (1) and (2) (images show full projection), right panel shows color coding of Ntrk3 FL levels in red, the brighter, the higher levels. k Distribution of the number of Ntrk3 FL molecules in E11.5 DRG neurons by smFISH, normalized to pan Ntrk3 (Ntrk3 FL represent 68% of all Ntrk3 transcripts). lTrkCCreER,R26tdTOM mice were injected at E9.75 with 4-OHT and analyzed at E11.5 (n = 3). m, n Frequency distribution (m) and pie chart (n) of TOM + /TRKC + neurons from l according to their level of TRKC intensity.
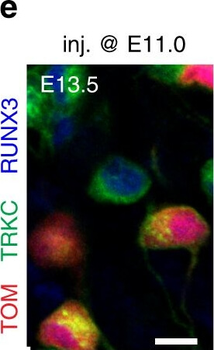
PSNs with high TRKC levels preferentially survive the cell death period. a Temporal fate mapping of TRKCHigh PSNs by 4-OHT (low dose, 0.02 g/kg). b-d Injection of TrkCCreER,R26tdTOM mice with low dose of 4-OHT at E11.0, DRG analyzed at E11.5 with recombination in few (b), preferentially high TRKC PSNs (c, d) (P < 0.001). Frequency distribution of TOM+ PSNs according to TRKC intensity (c) and pie charts (d) illustrating the large proportion of TOM+ cells among TRKCHigh PSNs. Scale bar: 50 µm. e, f Percentage of recombined PSNs at E11.5 and E13.5 in DRGs from TrkCCreER,R26tdTOM animals after 4-OHT injection at E11.0 (*P < 0.05, Students t-test, n = 2 litters with 6 embryos, E11.5, 2 litters with 5 embryos, E13.5). g The percentage of labeled PSNs does not change between E11.5 and E13.5 in R26CreERT2,R26tdTOM embryos injected at E11.0 with 0.032 g/kg 4-OHT (n = 4). Similarly, the recombination rate in TOM+ PSNs does not change between E14.5 and E16.5 in TrkCCreER,R26tdTOM embryos after injection at E14.0 with 0.02 g/kg 4-OHT (n = 2). Unpaired Students t-test. h Whole-mount immunostaining for TRKC, NF160 and RFP of E13.5 forelimb from TrkCCreER,R26tdTOM embryos injected with low dose 4-OHT at E11.0. Insert shows restricted number of TOM+ fibers dispersed amongst TRKC+ axons. Scale bar: 200 µm. i Pattern and color-coded depth (in micrometers) of innervation of TRKC+, NF160+ and RFP+ nerve fibers (processed from h) of E13.5 forelimb from TrkCCreER,R26tdTOM embryos injected with a low dose of 4-OHT (0.02 g/kg) at E11. The pattern and depth color code reveal similar territories (in all dimensions, xyz) of innervation of the TOM+ PSNs compared to all axons (NF160). Scale bar: 200 µm. j Scheme illustrating the preferential selection of TRKCHigh PSNs during the cell death period.
PSNs with high TRKC levels preferentially survive the cell death period. a Temporal fate mapping of TRKCHigh PSNs by 4-OHT (low dose, 0.02 g/kg). b-d Injection of TrkCCreER,R26tdTO
* VAT and and shipping costs not included. Errors and price changes excepted