![]()
|
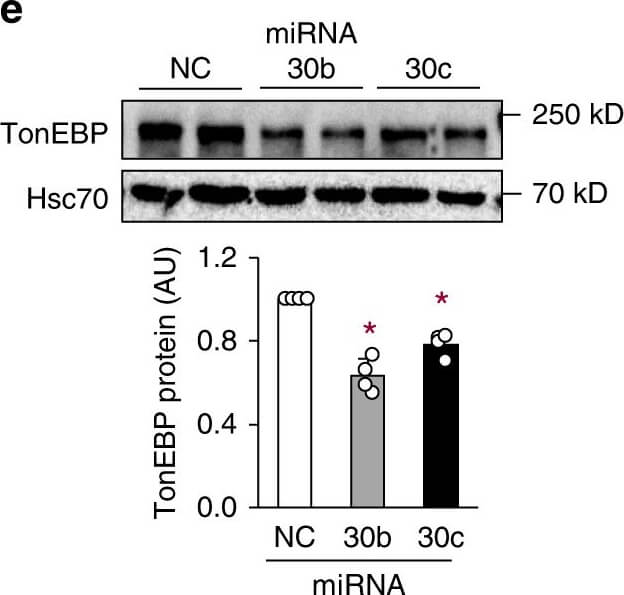
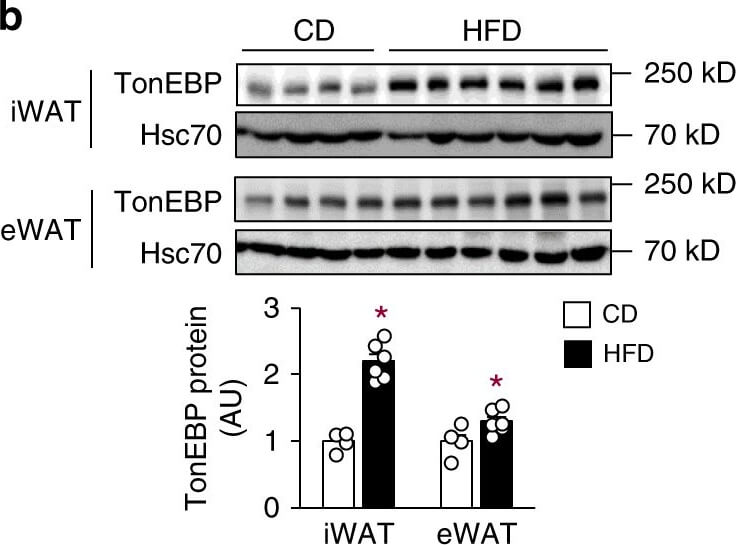
Adipocyte TonEBP expression is elevated in obesity and TonEBP-deficient mice resist obesity. aTonEBP mRNA levels in iWAT, eWAT, BAT, muscle, and liver from C57BL/6J mice fed with CD (chow diet, n=5) or HFD (high-fat diet, n=7) for 16 weeks. b Immunoblots (top) and quantification of protein levels (bottom) of TonEBP and Hsc70 in iWAT and eWAT (CD, n=4, HFD, n=6). c Correlation of TONEBP mRNA levels in human subcutaneous adipocytes and BMI (n=15). TonEBP mRNA (d) and representative immunoblots (e, top) and quantification of protein levels (e, bottom) in 3T3-L1 adipocytes transfected with miR-negative control (NC), miR-30b (30b), or miR-30c (30c) (n=4). f-iTonEBP+/delta mice (+/delta) and their TonEBP+/+ littermates (+/+) were fed with CD or HFD as indicated. f Changes in body weight after a switch to HFD (CD+/+, n=7, CD+/delta, n=7, HFD+/+, n=13, HFD+/delta, n=11). g Representative images of animals fed with HFD. h Body weight, height, fat mass, and lean mass (n=8). i Representative images (top) and weight (bottom) of fat pads from HFD-fed animals (n=4). n represents number of biologically independent samples (a-c, i) or animals (f-h) or independent experiments with triplicate (d, e). All data are presented as mean+s.e.m. (a, b, f, h, i) or+s.d. (d, e). AU, arbitrary unit. The p-values are determined by unpaired t-test (a,b, h, i) or one-way ANOVA (d-f). *p<0.05 vs. CD (a), NC (d), or +/+(f, h, i). Source data are provided as a Source Data file Figure provided by CiteAb. Source: Nat Commun, PMID: 31387996. |
![]()
|
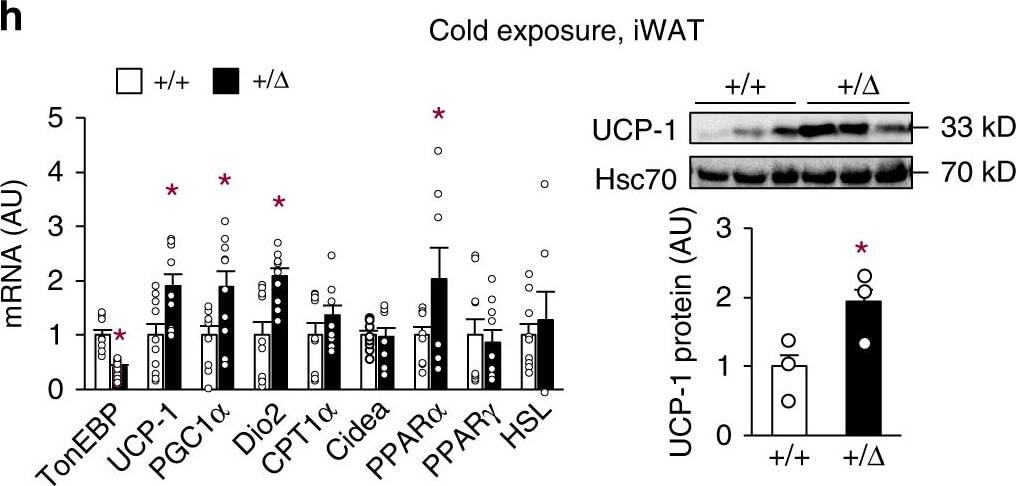
TonEBP deficiency promotes energy expenditure and beiging of WAT. HFD-fed animals were analyzed by indirect calorimetry to obtain VO2 (a), VCO2 (b), and heat production (c) (n=4). Rectal temperature (temp.) measured in CD-fed animals at room temperature (n=8) (d) and after exposure to cold up to 6h as indicated (4C) (n=6) (e). f, g mRNA abundance of thermogenic genes (f) and beiging marker genes (g) in iWAT of HFD-fed animals (n=5). h mRNA abundance of thermogenic genes (left, n=10) and immunoblots of UCP-1 and Hsc70 (right, n=3) in iWAT of |
![]()
|
|
![]()
|
Adipocyte TonEBP expression is elevated in obesity and TonEBP-deficient mice resist obesity. aTonEBP mRNA levels in iWAT, eWAT, BAT, muscle, and liver from C57BL/6J mice fed with CD (chow diet, n=5) or HFD (high-fat diet, n=7) for 16 weeks. b Immunoblots (top) and quantification of protein levels (bottom) of TonEBP and Hsc70 in iWAT and eWAT (CD, n=4, HFD, n=6). c Correlation of TONEBP mRNA levels in human subcutaneous adipocytes and BMI (n=15). TonEBP mRNA (d) and representative immunoblots (e, top) and quantification of protein levels (e, bottom) in 3T3-L1 adipocytes transfected with miR-negative control (NC), miR-30b (30b), or miR-30c (30c) (n=4). f-iTonEBP+/delta mice (+/delta) and their TonEBP+/+ littermates (+/+) were fed with CD or HFD as indicated. f Changes in body weight after a switch to HFD (CD+/+, n=7, CD+/delta, n=7, HFD+/+, n=13, HFD+/delta, n=11). g Representative images of animals fed with HFD. h Body weight, height, fat mass, and lean mass (n=8). i Representative images (top) and weight (bottom) of fat pads from HFD-fed animals (n=4). n represents number of biologically independent samples (a-c, i) or animals (f-h) or independent experiments with triplicate (d, e). All data are presented as mean+s.e.m. (a, b, f, h, i) or+s.d. (d, e). AU, arbitrary unit. The p-values are determined by unpaired t-test (a,b, h, i) or one-way ANOVA (d-f). *p<0.05 vs. CD (a), NC (d), or +/+(f, h, i). Source data are provided as a Source Data file Figure provided by CiteAb. Source: Nat Commun, PMID: 31387996. |
![]()
|
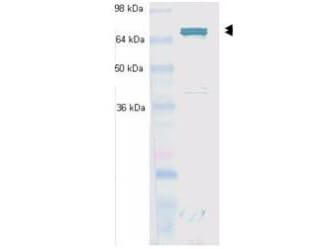
Western blot using Rocklands Protein G purified anti-Hsc70 (Hsp73) antibody shows detection of Hsc70 (Hsp73) in whole cell lysates from heat shocked HeLa cells. The band marked by the double arrowheads corresponds to Hsc70 (Hsp73) at an approximate molecular weight of 72/73 kDa. The primary antibody was used at a 1:1,000 dilution. |