![]()
|
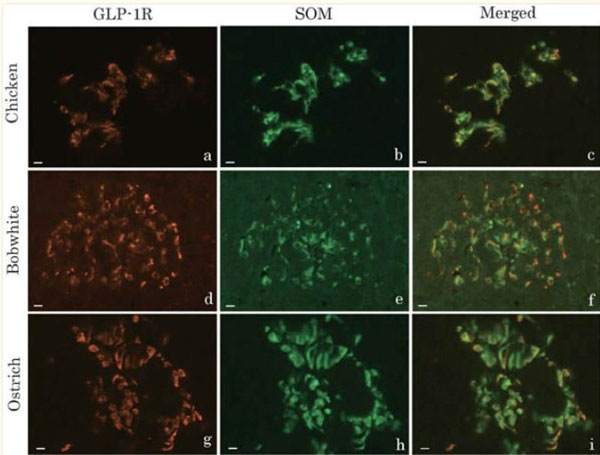
Double immunofluorescence images of glucagon-like peptide-1 receptor (GLP-1R, a, d, g) and somatostatin (SOM, b, e, h) in the pancreatic islets of chickens (a-c), northern bobwhites (d-f), and ostriches (g-i).Figuresc,f, andishow merged images of a andb,dande, andgandh, respectively. Almost every SOM-immunoreactive cell in the pancreatic islets of three avian species also demonstrated GLP-1R immunoreactivity. Bars indicate 10µm. Fig. 1. PMID: 32055175. |
![]()
|
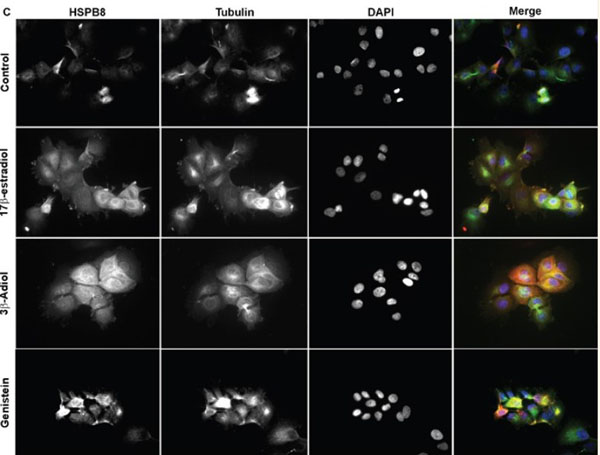
Expression of HSPB8 in MCF-7 cell lineHSPB8 mRNA and protein levels were quantified by real-time RT-PCR analysis.(C) Representative pictures of immunofluorescence staining of HSPB8 (red, anti-rabbit) and alpha-tubulin (green, anti-mouse) in MCF-7 cells, treated as above for 2 days. DAPI (blue) was used to stain DNA. *p<0.05vsControl. Values represent the mean from three independent experiments. C. Control cells, E: 17beta-estradiol, EV: estradiol valerate, 3beta: 3beta-Adiol, Gen: genistein, Ral: raloxifen, Tam: tamoxifen. Fig 3. PMID: 28060751. |
![]()
|
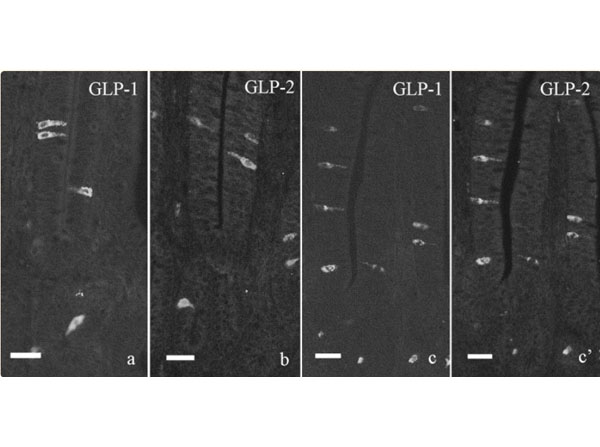
Immunofluorescent staining for GLP-1 (a, c) and GLP-2 (b, c) in the chicken distal ileum. a, b: Single immunofluorescent staining for GLP-1 (a) and GLP-2 (b). Both immunoreactive cells are scattered in villous epithelium and crypt of the distal ileum and show the similar localization to that indicated by double immunofluorescent staining. c, c: Double immunofluorescent staining for GLP-1 (c) and GLP-2 (c). Most GLP-1-immunoreactive cells also show immunoreactivity for GLP-2. Bar=20µm. Fig. 1. PMID: 23759686. |
![]()
|
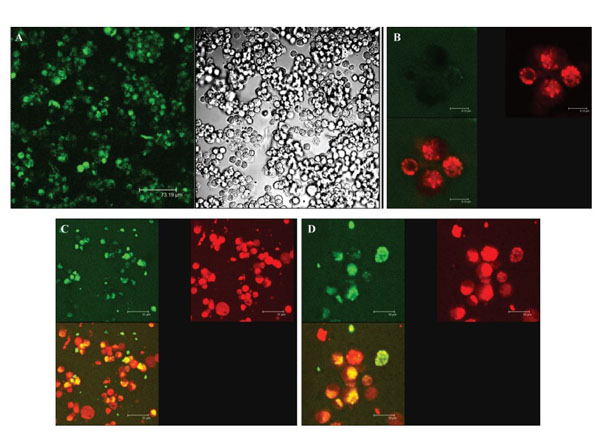
Confocal microscopy imaging of particles coated by BODIPY-labeled (green fluorescence) and CD14 stained NR8383 cells (red fluorescence): (A) Cells exposed to 10 µg/cm2 DQ12 after 30 min of incubation (Left: fluorescence image, right: transmitted light image of not stained cells) (B) Unexposed cells (C) Cells exposed to 10 µg/cm2 of DQ12 after 60 min of incubation (D) Cells exposed to 10 µg/cm2 of CS after 60 min of incubation. For B, C, and D: Upper left: transmitted green fluorescence, Upper right: transmitted red fluorescence, Lower left: transmitted fused green and red fluorescence, Lower right: sham. FIG. 2. PMID: 18803060. |
![]()
|
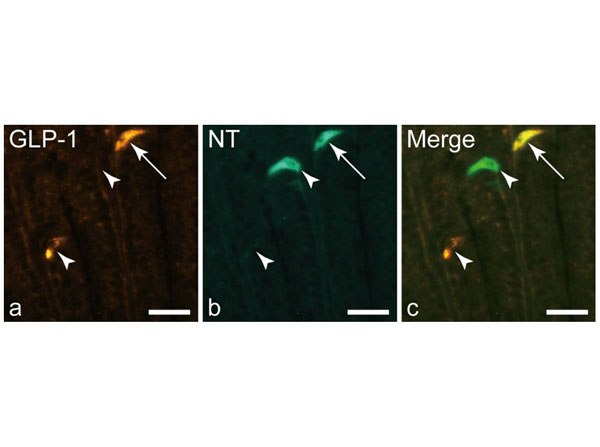
Distribution in the chicken distal ileum of three types of enteroendocrine cells. Enteroendocrine cell types were identified by a double immunofluorescence technique for glucagon-like peptide-1 (GLP-1) and neurotensin (NT). Arrows indicate cells showing immunoreactivity for both GLP-1 and NT (GLP-1+ /NT+ ). Arrowheads indicate cells containing either GLP-1 (GLP-1+ /NT- ) or NT (GLP-1- / NT+ ). Bars 20 µm. Fig. 1. PMID: 28108848. |
![]()
|
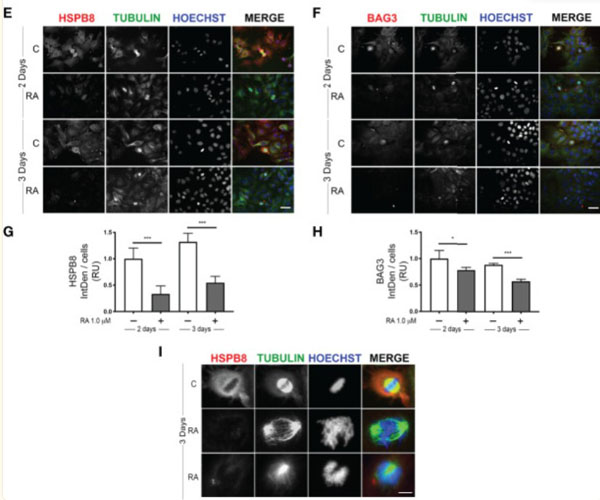
Effect of RA treatment in MCF-7 cells. (E)Immunofluorescence analysis of HSPB8 (red) and tubulin (green) in MCF-7 cells treated for 2 and 3 days with 1µM RA, nuclei were stained with Hoechst (scale bar = 20µm).(F)Immunofluorescence analysis of BAG3 (red) and tubulin (green) in MCF-7 cells treated for 2 and 3 days with 1µM RA (scale bar = 20µm).(G, H)Fluorescent intensity quantification of HSPB8 and BAG3, nuclei were stained with Hoechst.(I)Higher magnification of the mitotic spindle (scale bar = 5µm). *p < 0.05, **p < 0.01 and ***p < 0.005 in all charts. Graph bars represent the mean of three independent experiments. Figure1. PMID: 34136389. |