0.02 M Potassium Phosphate, 0.15 M Sodium Chloride, pH 7.2
Form:
Lyophilized
Target:
Rabbit
Antibody Type:
Secondary Antibody
Application Dilute:
FLISA: >1:20,000, IF Microscopy: >1:5,000, WB: >1:10,000
Application Notes:
Anti-Rabbit IgG (H&L) DyLight 405 Antibody is designed for immunofluorescence microscopy, fluorescence based plate assays (FLISA) and fluorescent western blotting. This product is also suitable for multiplex analysis, including multicolor imaging, utiliz
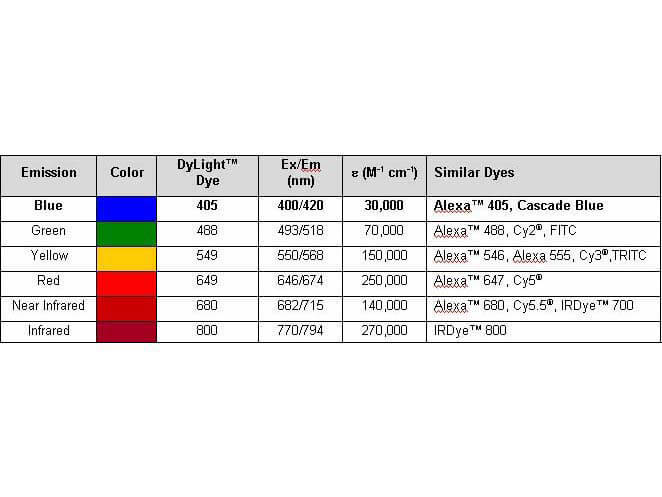
Properties of DyLight(TM) Conjugates.
Immunofluorescence results using Donkey Anti-Rabbit IgG DyLight(TM)405. After application of hTERT-DNA-PEI complex, hTERT protein expression promoted proliferation of hair follicle stem cells and enhanced hair growth. Immunofluorescent staining of hTERT and PCNA in dorsal skin treated with DNA-PEI complex (f, stars, i, triangles) at day 40 after wounding compared with non-treated control (d, g), respectively. (f, i) Displayed higher magnification micrographs of (e) and (h), respectively. Figure 6. PMID: 21593794.
Epifluorescence results of Donkey Anti-Rabbit IgG DyLight(TM)405. Principle of Single Molecule Localization Microscopy (SMLM). A. Epifluorescence image of a single emitter, showing the 200 nm width of the Point Spread Function (PSF, left panel) that is fitted using Gaussian curves (center panel) to determine its position with a 20 nm precision (right panel). B. Epifluorescence image of microtubules in a COS cell. C. During SMLM acquisition, fluorescence emission is switched to a blinking mode and thousands of frames are recorded, showing individual blinking events that can be fitted to localize each emitter. D. After processing, all localizations are plotted to generate the SMLM images (bottom panels). Top panel is a zoom corresponding to the box highlighted in the full image and shows the gain in resolution with much thinner microtubules (top panels). Fig. 1. PMID: 31078795.
Immunofluorescence results using Donkey Anti-Rabbit IgG DyLight(TM)405.(e-f) The expression of hTERT (e) and PCNA (f) was detected by immunofluorescence microscopy using the Abs indicated. The transfected groups were shown as 'D+P and non-transfected group were shown as 'Neg at day 18 after transfection. The color reproduction of this figure is available on the html full text version of the manuscript. Figure 4. PMID: 21593794.
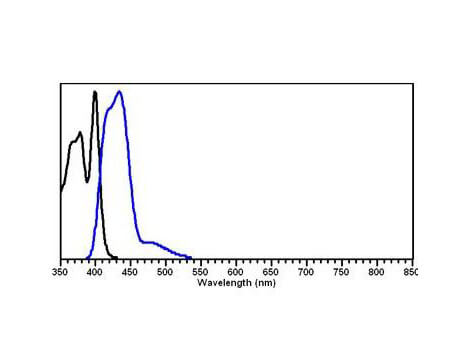
DyLight(TM) 405 Fluorescence Spectra.
* VAT and and shipping costs not included. Errors and price changes excepted