
Normal Goat Serum (NGS)
Catalog Number:
ROC-B304
- Images (6)
| Article Name: | Normal Goat Serum (NGS) |
| Biozol Catalog Number: | ROC-B304 |
| Supplier Catalog Number: | B304 |
| Alternative Catalog Number: | ROC-B304 |
| Manufacturer: | Rockland Immunochemicals |
| Category: | Zellen/Zellkultur |
| Application: | SDS-PAGE |
| Conjugation: | Unconjugated |
| Alternative Names: | blocking goat serum, blocking grade goat serum, 10% NGS, normal goat serum, goat serum blocking buffer |
| Concentration: | 110 mg/mL by Refractometry |
| Buffer: | 0.02 M Potassium Phosphate, 0.15 M Sodium Chloride, pH 7.2 |
| Form: | Lyophilized |
| Application Dilute: | ELISA: User Optimized, FLISA: User Optimized, Flow Cytometry: User Optimized, IHC: User Optimized, IF Microscopy: User Optimized, IP: User Optimized, WB: User Optimized |
| Application Notes: | Goat Serum blocking reagent or NGS has been tested by SDS-PAGE and is ideal for blocking procedures such as Western Blotting, ELISA and immunochemistry to prevent nonspecific binding. |
|
|
Normal Goat Serum (NGS) |
|
|
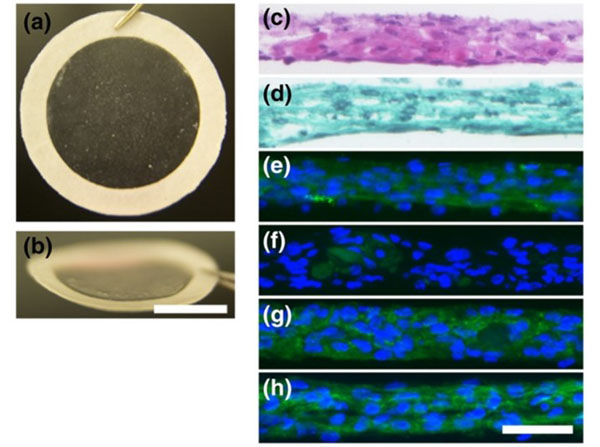
Representative macrographs and micrographs of TKA sheets. (a) Macrograph of a TKA sheet attached to a PVDF support membrane and (b) the same thin sheet seen from an angle. Scale bar=1cm. Histological analysis of sections of layered chondrocyte sheets stained with (c) HE and (d) Safranin O. Immunohistochemical analysis revealed (e) positive staining for COL1, (f) slight staining for COL2, (g) positive staining for ACAN, and (h) positive staining for FN. Scale bar=50 µm. TKA sheets were fixed in 4% paraformaldehyde in phosphate buffer and embedded in optimal cutting temperature compound. Twenty-micrometre-thick sections were stained with haematoxylin and eosin (HE) or with Safranin O, Fast Green, and HE. For immunohistochemical analysis, 10-µm sections were blocked with 5% normal goat serum (NGS, p/n B304) and 0.3% Triton X-100 in phosphate buffer for 30min. The sections were then incubated with primary antibodies (COL1, dilution 1:200), (COL2, dilution 1:200), (ACAN, dilution 1:10), or (FN, dilution 1:500) at 4C overnight. ACAN: aggrecan, COL1: Type I collagen, COL2: Type II collagen, FN: fibronectin, HE: haematoxylin and eosin, TKA: total knee arthroplasty, PVDF: polyvinylidene difluoride. Figure 1. PMID: 30058138. |
|
|
|
|
|
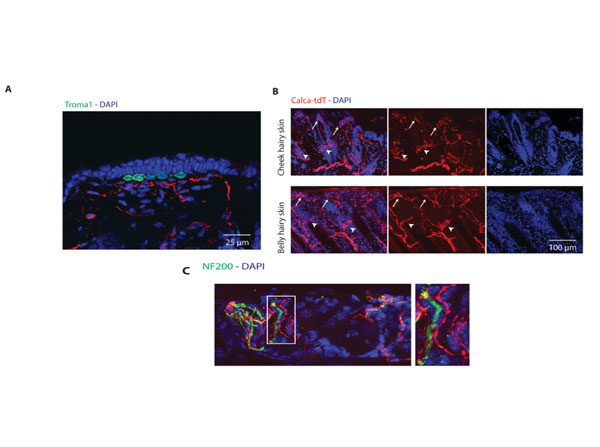
Calca-tdT neurons produce circumferential endings around hair shafts and free nerve endings in hairy skin independent of merkel cells. Hair from the skin of the back of mice was removed using a depilatory cream, and cut into square pieces of approximately 5 mm * 5 mm. The tissues were fixed in 4% PFA in PBS at 4 C for 3-5 days. After a PBS wash, tissues were mounted in OCT medium, and sectioned at 80-90 µm on a cryostat. Skin sections were rinsed in PBS and incubated in blocking buffer (5% goat serum [p/n B304], 0.5% Triton-X100) for 3 hours at room temperature. Sections were incubated in primary antibodies in blocking buffer at 4C overnight. Sections were rinsed and incubated overnight in AlexaFluor conjugated secondary antibodies. (A) Immunostaining for Troma-1 (green) shows Calca l |
|
|
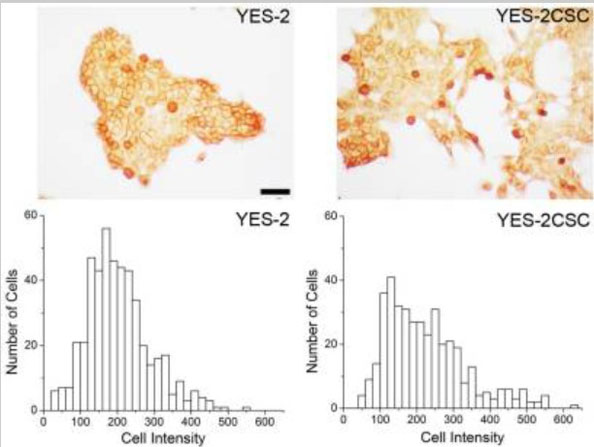
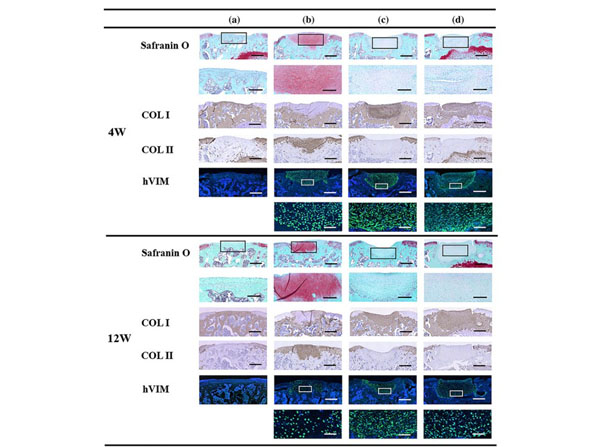
Representative microscopic images from the histological and immunohistochemical analyses. Frozen sections were blocked with 5% normal goat serum (NGS, p/n B304). Group A, untreated, Group B, LC sheet containing 5.0 * 105cells alone, Group C, SY sheet containing 5.0 * 105cells alone, and Group D, SY sheet plus LC sheet, each containing 5.0 * 105cells. For each group,n= 6. Four weeks after transplantation in Groups B, C, and D, the defects were filled with repaired tissue. Histological analysis of Group A revealed no Safranin O staining or formation of a chondral layer but revealed bone-like tissue or fibrous tissue. In Group B, strong Safranin O staining was observed. In Groups C and D, no Safranin O staining was observed. Immunohistochemical analysis revealed negative staining for COL II and hVIM in Group A, positive staining for COL II and hVIM in Group B, and positive staining for COL I and hVIM in Groups C and D. At 12 weeks after transplantation, the defects in Groups B, C, and D, in which transplantation was performed, were filled with repaired tissue. Histological analysis of Group A revealed no Safranin O staining or formation of a chondral layer but revealed bone-like tissue. In Group B, strong Safranin O staining was observed. In Groups C and D, no Safranin O staining was observed. Immunohistochemical analysis revealed negative staining for COL II and hVIM in Group A, positive staining for COL II and hVIM and partial staining for COL I in Group B, and positive staining for COL I and hVIM in Groups C and D. Low-power images of Safranin O, COL I, COL II, and hVIM staining are shown in the upper rows (scale bar = 500 µm). High-power images of Safranin O and hVIM are shown in the lower rows (scale bar of Safranin O = 200 µm, scale bar of hVIM = 50 µm). LC: layered chondrocyte, SY: synoviocyte, COL I: type I collagen, COL II: type II collagen, hVIM: human vimentin. Fig 3. PMID: 32652894. |
|
|
Product Guarantee and Expert Support
