0.02 M Potassium Phosphate, 0.15 M Sodium Chloride, pH 7.2
Source:
Mouse
Form:
Lyophilized
Application Dilute:
ELISA: User Optimized, IHC: User Optimized, WB: User Optimized
Application Notes:
Mouse gamma globulin blocking reagent has been tested by SDS-PAGE and is an ideal blocker for western blotting, ELISA, Immunohistochemistry and other detection assays.
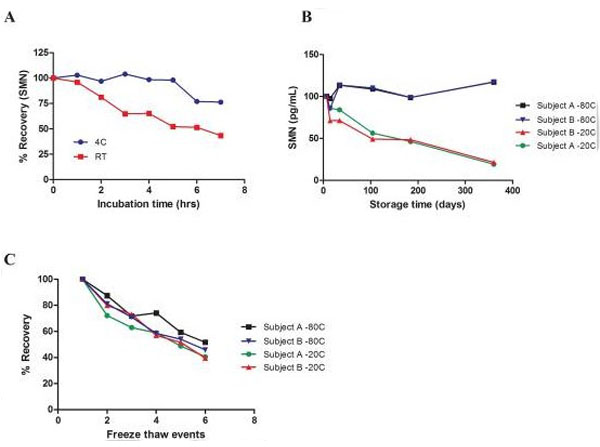
SMN protein stability in whole blood: short term, long term, and freeze / thaw events. Whole blood of healthy subjects was used in the study. (A) SMN protein was measured in previously frozen, undiluted whole blood samples incubated at 4C or at room temperature. (B) SMN protein was measured in undiluted whole blood samples of two subjects stored at -80C or at -20C. (C) SMN protein levels were measured in samples of two subjects that went through freeze-thaw cycles. *FDA acceptance criteria (below 85%). Primary and secondary detection antibodies were diluted into the following buffer: 50mM Tris, 137.5 mM NaCl, 1% (w/v) BSA, 0.05% (w/v) Tween 20, 0.2% mouse gamma globulin fraction (p/n D609-0100), pH 7.5.Fig 1. PMID: 26953792.
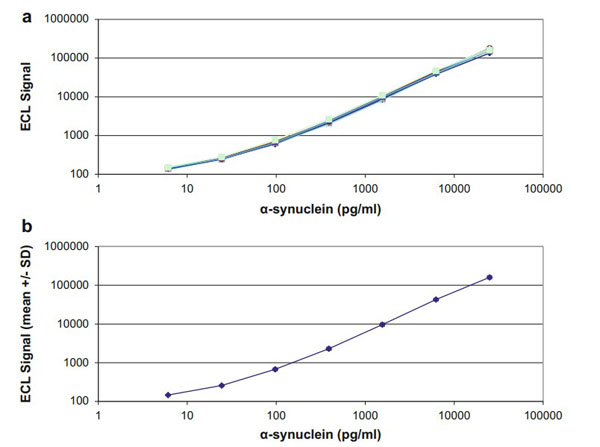
Reproducibility of alpha-synuclein standard curves. A. Individual standard curves from 11 independent experiments. B. Mean values of ECL signals standard deviation for defined alpha-synuclein concentrations from the 17 experiments. Note that CVs were less than 20% over the entire range. Detection antibody solution: Dilute SULFO-TAG-labeled Syn1 clone 42/alpha-synuclein antibody to 1 µg/mL in sample dilution buffer supplemented with 0.1% mouse IgG (p/n D609-0100) and 0.1% goat IgG. Fig. 2. PMID: 30771170.
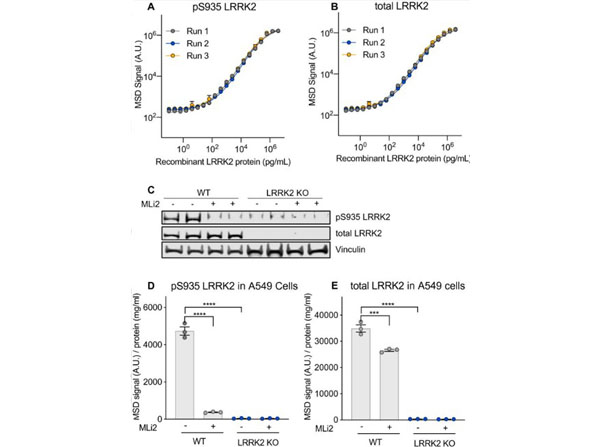
Development of specific, quantitative and high-throughput assays to measure pS935 LRRK2 and total LRRK2. (A,B) Novel MSD assays to measure pS935 LRRK2 and total LRRK2 levels can detect increasing amounts of recombinant LRRK2 protein, n=3. (C) Specific detection of pS935 LRRK2 and total LRRK2 was confirmed in WT andLRRK2KO A549 cells with and without LRRK2 kinase inhibitor treatment (MLi-2, 500nM, 2h) measured by western blot analysis. (D,E) Consistent with western blot data, the LRRK2 MSD assays specifically detected pS935 LRRK2 and total LRRK2 in A549 cells, n=3. MSD signals were normalized for protein concentration, and data are shown as meanSEM with p values: one-way ANOVA with Tukeys multiple comparison test, ***p 0.001, ****p 0.0001, AU, arbitrary units. Detection antibodies (15µl for 384-well) were added to each well diluted in TBST containing 25% MSD blocker A with rabbit (p/n D610-1000) and mouse gamma globin fraction (p/n D609-0100). Fig 1. PMID: 34145320.
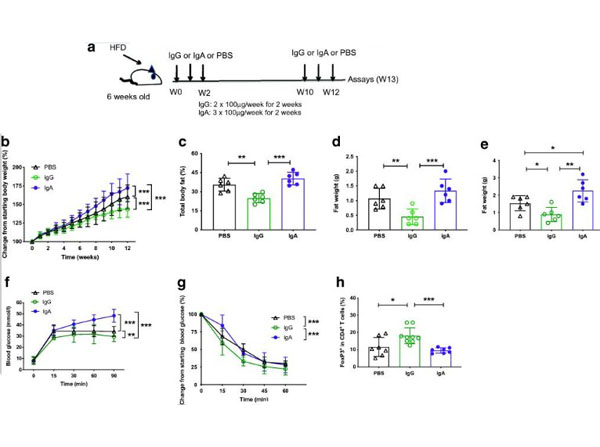
IgG infusion inAid-/-mice ameliorates the exacerbated HFDIO and promotes Treg cells in adipose tissue. Six-week-old maleAid+/+andAid-/-mice were fed with HFD for 13weeks and received purified mouse IgG (p/n D609-0100), IgA (p/n 010-001-341) or PBS by i.v. injection during the first two and last two weeks of the diet. (a) Depiction of the study design. (b) Proportional body weight change post-injection compared with starting body weight. (c-e) Proportion of total body fat assessed by Micro-CT (c) and weight of inguinal adipose tissue (d) and epididymal adipose tissue (e). (f,g) In vivo glucose (f) and insulin (g) tolerance responses from IgG-, IgA- or PBS-infused mice. Proportion of infiltrating Treg cells in the visceral fat, identified by flow cytometry, gated from live, single CD4+T cells prior to gating on FoxP3+cells (h). Data shown are pooled from two independent experiments.n=6-8 per group. Data were assessed for significance using Studentsttest (c-e,h) or two-way ANOVA (b,f,g). Data are presented as meanSD. *p<0.05, **p<0.01, ***p<0.001. W, week. Fig. 7. PMID: 35587276.
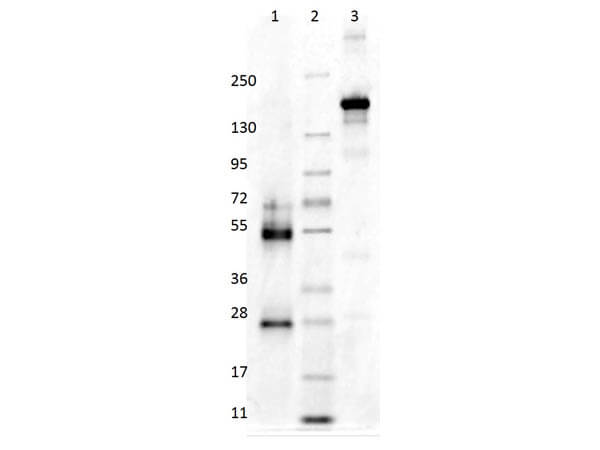
SDS-Page of MOUSE Gamma Globulin Fraction. Lane 1: Mouse Gamma Globulin Reduced. Lane 2: Molecular Weight Marker. Lane 3: Mouse Gamma Globulin Non-Reduced. Load: 1.0 µg per lane. Predicted/Observed size-Reduced: 55 and 28 kDa. Predicted/Observed size-Non-Reduced: 160 kDa.
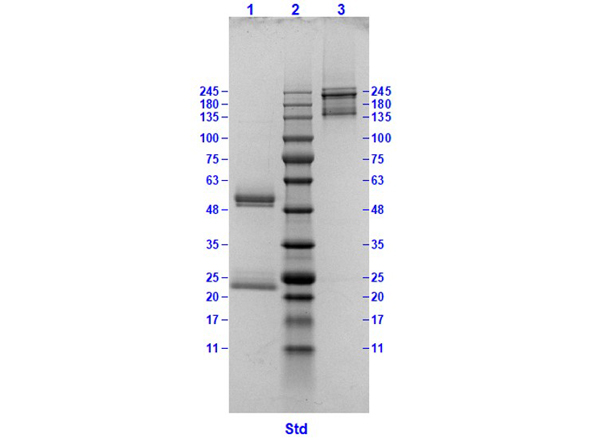
SDS results of Mouse Gamma Globulin Fraction. Lane 1: Ms Gamma Globulin [2µg reduced]. Lane 2: Prestained MW marker (p/n MB-210-0500). Lane 3: Ms Gamma Globulin [2µg non-reduced]. Coomassie stained.Predicted/Observed size: Reduced: 55 and 28 kDa, Non-Reduced: ~160 kDa.
* VAT and and shipping costs not included. Errors and price changes excepted