Sheep Washed Pooled Cells, Sheep WPCs, Sheep Red Blood Cells, Sheep RBCs, sheep erythrocytes
Buffer:
None
Source:
Sheep
Form:
Liquid
Application Notes:
Complement titration, adsorption procedures, HA assays and for the preparation of stroma as particulate reagents.
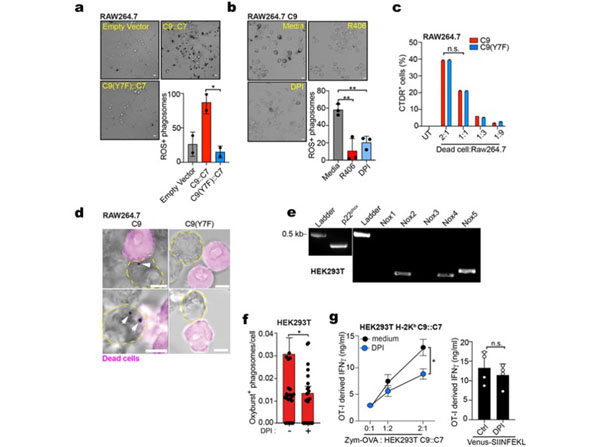
DNGR signalling promotes phagosomal ROS production. a-b, Confocal images of RAW264.7 cells transfected with empty vector or plasmid encoding C9::C7 or C9(Y7F)::C7 receptors and pulsed with zymosan (a) or dead sRBCs (b) in the presence of Nitroblue tetrazolium (NBT) (Scale bar 10 µm). Quantification of ROS+phagosomes. Data represented as mean ( s.e.m.) (a) or ( s.d.) (b) and are representative of two independent determinations (n= 2).Pvalues determined by one-way ANOVA.c,RAW264.7 stably expressing C9 or C9(Y7F) receptors were pulsed with CellTracker DeepRed (CTDR)-labelled FP-sRBCs for 2 hrs. Percentage of CTDR+RAW264.7 cells was quantified by flow cytometry. Data represented as mean ( s.d.) and are representative of two independent experiments (n = 2).d, Confocal images of RAW264.7 stably expressing C9 or C9(Y7F) receptors pulsed with dead cells in the presence of NBT for 2 hrs (scale bars 10 µm). Image is a representative image of three similar images.e,RT-PCR of NADPH oxidase subunits in HEK293T. Representative of two experiments (n= 2).f, HEK293T cells stably expressing C9::C7 were challenged with zymosan-Oxyburst in the presence or absence of DPI for 1 hr. Oxyburst+positive phagosomes were quantified across 5 fields of view (n> 100 phagosomes). Data represented as mean ( s.e.m.). Pvalues were calculated by unpaired parametric test, Mann-Whitney and are representative of two independent experiments (n= 2).g,HEK293T C9::C7 cells were pulsed with zymosan-Ova (left) or transfected with plasmid encoding VENUS-SIINFEKL (right) in the presence or absence of DPI (10 µM) for 4 hrs before fixing and adding of OT-IRag1-/-T-cells. IFN-gamma was assessed by ELISA, plotted as mean ( s.d.) of an experimental triplicate. n.s., not significant, *P 0.05, **P 0.01. Extended Data Fig 6. PMID: 33349708.
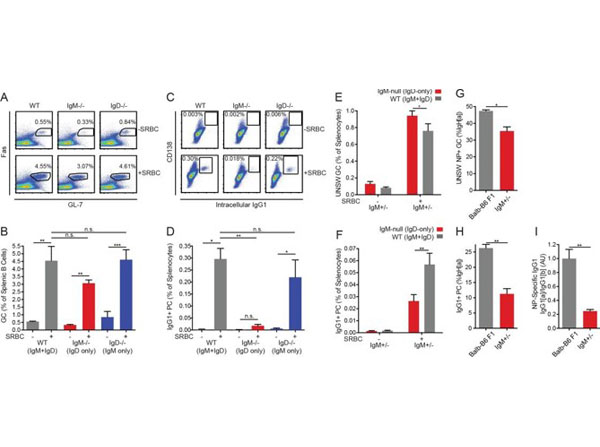
IgD-only cells have intact germinal center responses but impaired IgG1+ SLPC responses.(A) Splenic (CD19+) Bcells from WT,IgM-/-, andIgD-/-mice unimmunized or 5 days after i.p. immunization with 200 µL of 10% SRBCs. (B) Quantification of germinal center (FashiGL-7hi) cells in (A). (C) Splenocytes from mice in (A). (D) Quantification of CD138+ IgG1+ plasma cells in (C). (E) WT (IgMb+) and IgM-null (IgDa+) germinal center B cells as a percentage of live splenocytes in unimmunized andIgM+/-mice 5 days after i.p. immunization with 200 µL of 10% SRBCs. (F) WT (IgG1b+) and IgM-null (IgG1a+) switched plasma cells (CD138 +IgG1+) as a percentage of live splenocytes inIgM+/-mice unimmunized or 5 days after i.p. immunization with 200 µL of 10% SRBCs. (G) Fraction of unswitched NP-specific germinal center cells (CD19+ FashiGL-7hiIgM/IgD+) from the IgHalocus in the spleens of Balb/c-B6 F1 andIgM+/-mice 7-8 days after i.p. immunization with 100 µg NP-RSA. (H) Fraction of IgG1+CD138+ plasma cells from the IgHalocus in Balb/c-B6 F1 andIgM+/-mice 7-8 days after i.p. immunization with 100 µg NP-RSA. (I) NP-specific IgG1aand IgG1btiters at OD = 0.2 were calculated for the mice in (G-H) by ELISA. The IgG1ato IgG1btiter ratio was calculated for each mouse, and all ratios were normalized such that the average IgG1a/IgG1bratio in Balb/c-B6 F1 samples = 1.0. For (A-D), statistics from n = 4 unimmunized mice of each genotype and n = 3 WT, n = 6IgM-/-, and n = 7IgD-/-immunized mice were pooled. For (E-F), n = 5 unimmunized and n = 5 immunized mice are shown. For (G-I), n = 5 Balb/c-B6 F1 mice and n = 3IgM+/-mice are shown. One-way ANOVA with Tukeys multiple comparisons test (B and D), a paired t test (E-F), and Welchs t test (G-I) were used to calculate p values, and mean +SEM is displayed. *p<0.05, **p<0.01, ***p<0.001. Figure 7. PMID: 29521626.
* VAT and and shipping costs not included. Errors and price changes excepted